Hidden costs of commuting: The real cost of returning to the office
Remember those days when going to work meant rolling out of your bed, grabbing a cup of coffee, checking your phone, and then ambling a few feet to your home office? Those days are fast disappearing because the commute is back. And it’s more expensive than ever.
The number of workers who commute five days a week or more has risen to half, i.e.,49 percent, according to Ipsos, while the number of people who don’t have to go to the office at all has dropped by half to 13%. Bear in mind that the average American spends more than 27 minutes just getting to work. This is not including traffic snarls, time spent searching for parking, at tolls and gas stations, or the 20 minutes of your life you just lost to someone who doesn’t seem to have the faintest idea about merging. That’s just the time lost due to your commute, not the money. Because when you start adding up all those expenses, the big ones like gas and the little ones like parking, it adds up to quite a bit!
Fuel & Maintenance Expenses
Let’s tackle the most obvious one first – fuel. It’s also the fastest-rising expense. The average price for a gallon of regular gasoline was $4.01 by the end of August 2026, according to the U.S. Energy Information Administration, almost a dollar more than what it cost during the same time last year.
The cost of maintaining and repairing a car grew 0.6% month-over-month and 6.6% year-over-year. Oddly enough, the only cost that did not go up is auto insurance. In fact, the motor vehicle insurance index went down by 0.3 percent in July after declining 2 percent in June. That said, the national average cost of full-coverage car insurance is $187 per month, according to Insurify.
The cost of owning or leasing a car
Owning or even leasing a car is another major cost that needs to be factored into commuting costs. The cost of owning a vehicle is $11,557 (77.18 cents/mile) for people who drive approximately 15,000 miles a year. If you’re financing your car, you can expect your monthly payment to average $777 (a new record), according to Edmunds. They also noted that 20.3%, i.e, one in five new-vehicle financers, took on monthly payments of $1,000 or more in the second quarter of 2026.
Leasing might be a little bit cheaper, but average monthly costs still hover between $613 and $659 according to the most recent Experian data.
More people on the road
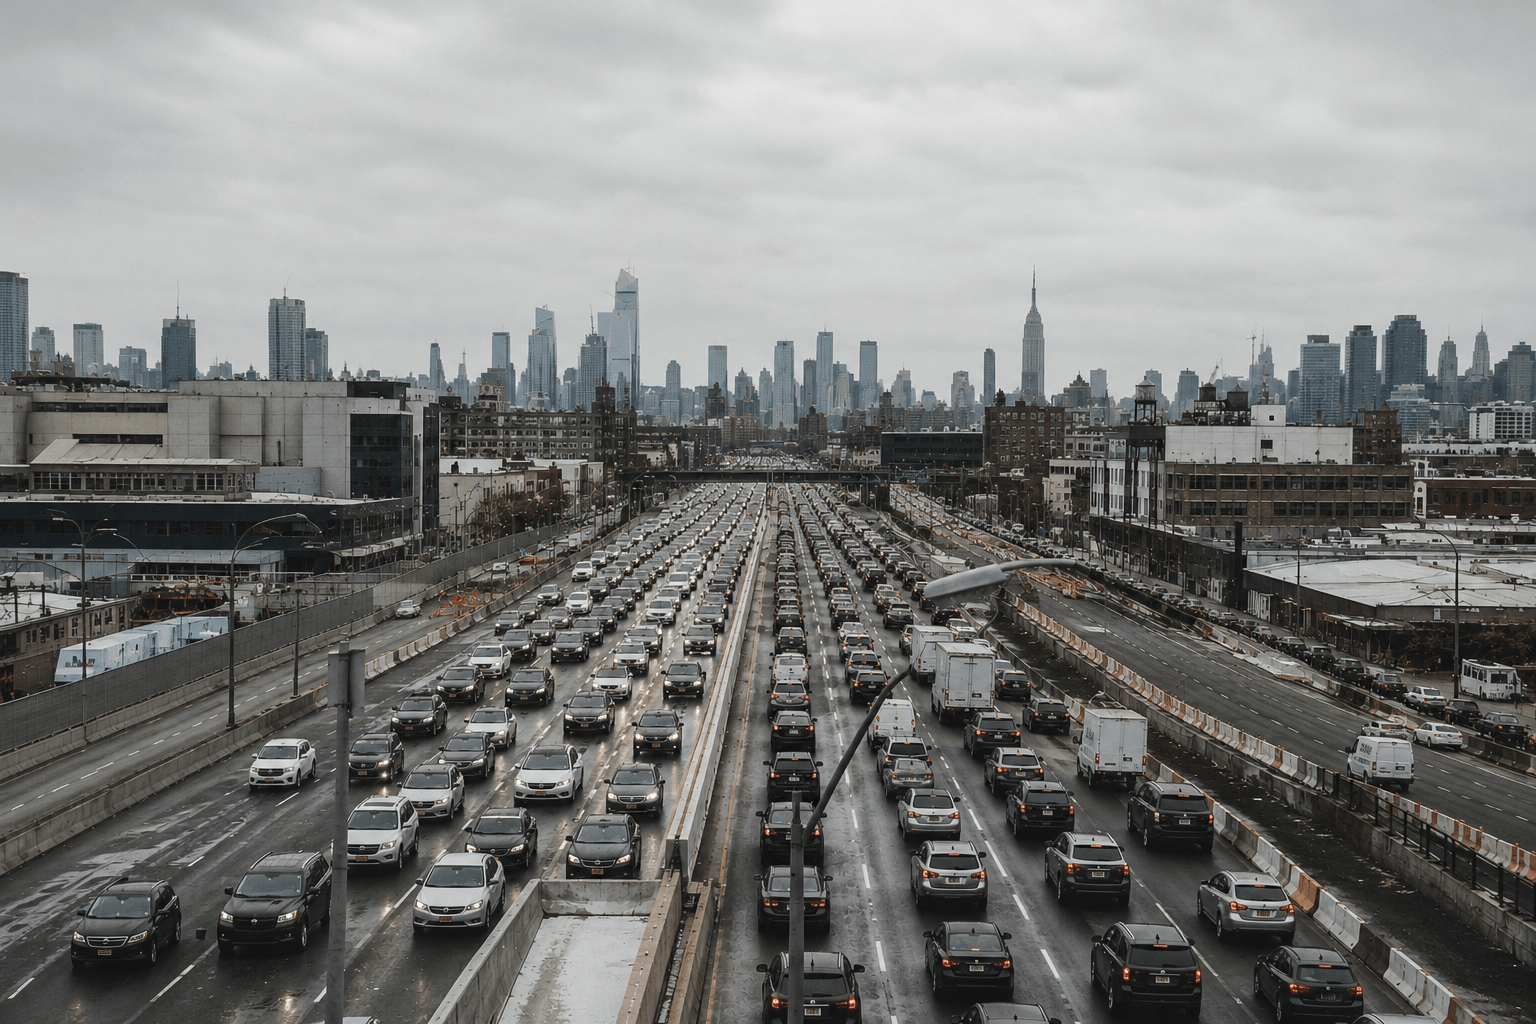
As we mentioned earlier, in-office requirements have spiked, and so have the number of commuters driving to work. More drivers means increased congestion on the road, as evidenced by INRIX’s 2025 Global Traffic Scorecard. 88% (254/290) of American cities have more congestion than before, and consequently, the average driver lost 49 hours in traffic in 2025 compared to 43 hours the year before. Chicago drivers fared the worst, losing up to 112 hours, while the usual suspects, New York drivers, spent 102 hours in traffic, and Philadelphians 101.
Idling in traffic not only increases your fuel bill and exasperation, but it also adds wear and tear to your vehicle, especially in stop-and-go traffic. The result? Engine damage, battery drain, and more oil changes.
The U.S. Census Bureau’s 2024 figures show that the average time for a one-way commute was 27.2 minutes. If you calculate the total time for a two-way commute over 240 workdays, it adds up to 218 hours. Since in-office numbers have gone up since 2024, we can assume that commuting time has gone up too.
Is public transport the answer?
The obvious answer to car ownership costs, ostensibly, is public transportation. However, those costs also rose by approximately 16% year over year, according to BLS July data.
Four of the six largest transit systems in the country raised their fares for 2026. New York’s MTA raised its base fare from 2.90 to 3 in January. In San Francisco, BART fees went up by 6.2% to $51.8. Chicago, too, had a scare with CTA announcing its first rail and bus fare increase in seven years, but then state legislation provided funding to cover shortfalls.
Data from INRIX shows that vehicle miles traveled (VMT) and car congestion have returned to or surpassed levels seen in 2019. However, public transit ridership is about 22% lower than it was before the pandemic. This is in line with Census data that shows 69.2% of American workers drove to work alone in 2024 (same as in 2023), while transit accounted for only 3.7%, well below the 5% seen in 2019.
States with high commuting costs
As you can see in the table below, states with the longest commutes aren’t always the ones with the most expensive ones.
| State | Mean one-way commute (min.) | Hours per year commuting | Avg. annual full-coverage auto insurance (2026 proj.) |
| United States | 27.2 | 218 | $2,158 |
| Longest average commutes | |||
| New York | 32.6 | 261 | $3,041 |
| Maryland | 31.1 | 249 | $3,594 |
| New Jersey | 30.5 | 244 | $3,024 |
| Massachusetts | 29.1 | 233 | $1,730 |
| California | 28.7 | 230 | $2,333 |
| Georgia | 28.3 | 226 | $2,992 |
| Florida | 28 | 224 | $2,734 |
| Illinois | 27.8 | 222 | $1,793 |
| Virginia | 27.3 | 218 | $2,325 |
| New Hampshire | 26.7 | 214 | $957 |
| Texas | 26.7 | 214 | $2,477 |
| Shortest average commutes | |||
| South Dakota | 17.8 | 142 | $1,789 |
| North Dakota | 17.9 | 143 | $1,147 |
| Wyoming | 18.8 | 150 | $1,054 |
| Montana | 19.1 | 153 | $1,793 |
| Nebraska | 19.2 | 154 | $1,517 |
| Alaska | 19.4 | 155 | Not reported |
| Kansas | 19.7 | 158 | $1,709 |
| Iowa | 19.8 | 158 | $1,230 |
| Idaho | 21.6 | 173 | $1,244 |
| Utah | 22.1 | 177 | $1,640 |
*Sources: Commute times via U.S. Census Bureau, American Community Survey 5-year estimates, 2020-2024. Hours per year calculated as one-way minutes × 2 × 240 working days. Insurance via Insurify 2026 projected average annual full-coverage premium, published Feb. 2, 2026. Insurify excludes Alaska from its dataset because of low quoting volume.
As you can see, New Hampshire is an anomaly here. Its average commute is 26.7 minutes, tying with Texas for the 10th-longest in the country. The interesting thing here is that it has the cheapest full-coverage auto insurance in the country at $957/year, a third of what a Maryland driver has to pay. While on the subject of Maryland, its drivers have the worst luck with the second-longest commute, 31.1 minutes, and the 2nd highest two-way premium, $3594. Now, factor in fuel costs. California’s average is $5.55 a gallon against $3.42 on the Gulf Coast. A 30-mile round trip costs much more in California, even if you don’t consider tolls, parking, and the high cost of services.
The cost of parking your car
Parking is another high cost for the average commuter, especially if their company doesn’t provide reserved parking for them. The BLS index shows that parking fees and tolls went up by 5.17% in 2024, 3.31% in 2025, and 2.282% through 2026 to date.
As the demand for parking increases, so do the prices. Portland, for instance, hiked up downtown parking fees by a dollar to $3.20 in 2026.
Adding more parking isn’t the solution, either. We looked at the UCLA Institute of Transportation Studies analysis that put the average cost of building underground parking at approx. $ 73,000 per space. The cost is slightly lower for above-ground parking but still significant at $52,000. The costs are based on 17 cities they analyzed, with costs ranging from $40,000 in Washington, D.C. to $111,000 in Portland, Oregon. The study also noted that since 2012, parking construction costs have increased about 50% faster than the general rate of inflation.
The trend in several cities has been to discourage building new parking lots and instead push residents towards using more public transport. In San Francisco, several new housing developments are exempt from including parking. This adds more demand for on-street parking and local lots from residents who move in.
When we looked at Way’s own booking data, it told a tale of sharp demand spikes. Weekday parking reservations across Way’s 10 largest markets rose 41% from January 1 to July 31 in 2025 and the same time period in 2026. The increase, however, was far from evenly spread. New York weekday bookings climbed 73%, Boston more than tripled, and Philadelphia more than quadrupled, while San Francisco slipped 3% and Washington fell 14%.
That demand has not pushed up parking prices by a lot, though. The average daily rate for a reserved space downtown was flat across these markets, down by about 1% year over year.
Again, the story was not the same across the country. Atlanta parking prices rose by 21% to $28.32 a day! Los Angeles saw an increase of 11% to $24.75, while Philadelphia went the other way with prices dipping by 30% to $25.83. Prices also dropped in New Orleans ($36.20) and New York ($31.44) by more than 12%.
There’s another story here. The day-of-the-week pattern is quite surprising, and it doesn’t have much to do with commuting. Friday is the busiest day for reservations at 16% of volume, with Saturday and Thursday close behind at just over 15% each. Monday is the quietest weekday at 13% and Sunday the quietest overall at 10.9%. Saturday and Sunday together account for more than a quarter of every reservation Way takes.
Hiding in plain sight
More and more companies are asking employees to come into the office more often, making commuting a huge expense that most American workers can’t avoid. You might not notice these costs right away because each cost might seem small in isolation. But add it all up, and it takes a huge chunk of your monthly budget. This could very well be why your money doesn’t seem to stretch as far as it once did.

